
Estimating the performance impact of new use-cases or features like Tiered Storage on Kafka clusters can be challenging. In this post, let’s explore OpenMessaging Benchmark, a macro-benchmarking framework for measuring messaging system performance, and how to use it on Apache Kafka deployments.
OpenMessaging Benchmark (OMB) is an industry-standard framework that emerged from the collaborative efforts of messaging platform providers to create consistent, reproducible performance measurements; and it has become a trusted tool used by major vendors[1] to validate their platform performance claims.
OMB’s architecture consists of three main components:
- Workers: processes executing the actual workload
- Workloads: producer, consumers, and message distribution setup
- Drivers: connection and tuning parameters
and it can run in two modes: distributed and local.
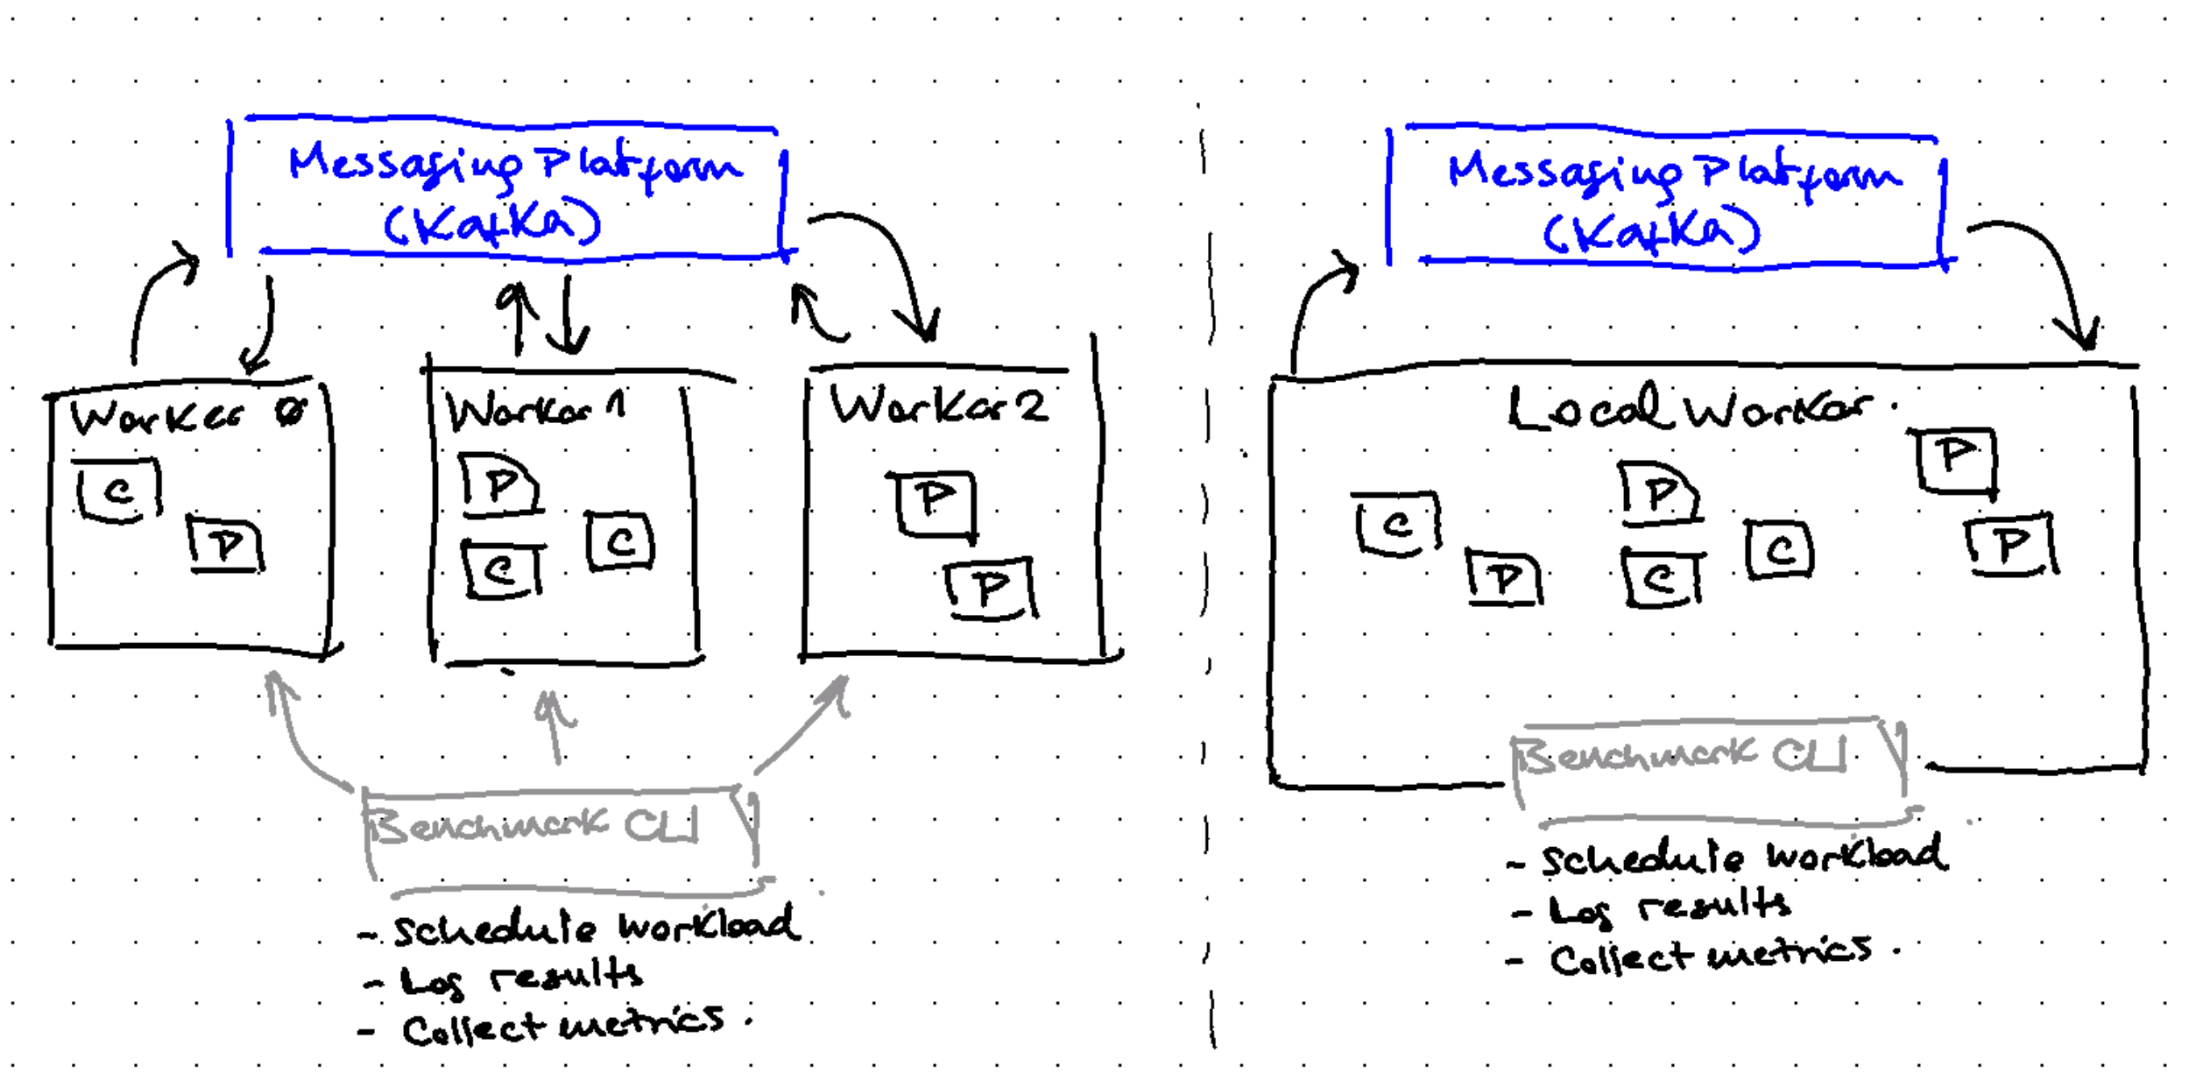
Distributed mode:
- Workers (2 or more) are deployed across multiple nodes exposing a REST endpoint
- Benchmark CLI uses these endpoints to coordinate the workload execution
- It’s the most-used mode, ideal for production-like performance testing
Local mode:
- Single process running the workload
- Perfect for getting started and initial testing
- Simpler setup, though with limited scalability
To start running benchmarks we will need:
- Set up Workers (either locally or distributed) and ensure they can access the Kafka cluster
- Define Driver and Workload specifications
- Use benchmark CLI to initiate the test
Let’s start by running a simple workload using the local mode to get familiar with OMB’s capabilities.
Demo

Install OMB binaries
Before getting started, let’s quickly describe how to obtain the binaries:
Building from source is the default way to get the binaries:
git clone git@github.com:openmessaging/benchmark
cd benchmark
mvn package
This compiles all the modules and packages a tar file under ./package/target. You can either unpack binaries to a different location, or start using the binaries directly as the modules are now compiled—or download a pre-compiled version from my fork
Place your terminal in your chosen location to run the binaries.
Running first benchmark
Remember the 3 things we need to run a benchmark: A running cluster, benchmark workers, a driver, and a workload specification.
Start a Kafka cluster
Let’s start a local Kafka cluster if you don’t have one already. Recently, this is as easy as:
docker run -p 9092:9092 apache/kafka:3.9.0
Driver
The Driver specification defines key configuration properties for topics, clients, producers, and consumers. Here’s a basic configuration:
name: kafka-local
driverClass: io.openmessaging.benchmark.driver.kafka.KafkaBenchmarkDriver

topicConfig: ""
replicationFactor: 1

# Kafka client-specific configuration
commonConfig: |
  bootstrap.servers=localhost:9092
producerConfig: ""
consumerConfig: |
  auto.offset.reset=earliest
auto.offset.reset=earliestshould be the default. Without it benchmark checks do not pass as Consumer is expecting new messages after the producer has sent the test message :)
All *Config properties are strings. Use multi-line to add multiple configurations.
commonConfigis used by Admin client (for topic creation, etc.), and inherited by producers and consumers. Used for security configurations.producerConfigandconsumerConfigare used to tune these clients (e.g., configure batching); andtopicConfigconfigure the topics created (e.g. enable compaction, set minimum ISR, etc.)
With these defined, let’s move to the Workload spec.
Workload
Workload defines how producers and consumers are scheduled, how many topics and partitions, how load is distributed, and the execution mode.
In this post let’s focus on the simplest one: define fixed-throughput workload:
- Duration: 1 minute warm up, 5 minutes benchmark
- 1 topic, 10 partitions
- Thoughput: fixed, 1MiB/sec (1024 msg/sec * 1KiB msg size)
- 1 Producer, 1 Consumer group with 1 instance
name: fixed-1MiB-1t10p-1P1x1C

# Duration
warmupDurationMinutes: 1
testDurationMinutes: 5

# Topic topology
topics: 1
partitionsPerTopic: 10

# Throughput
producerRate: 1024
messageSize: 1024
payloadFile: "payload/payload-1Kb.data"

# Producers
producersPerTopic: 1

# Consumers
subscriptionsPerTopic: 1
consumerPerSubscription: 1
Run the benchmark
bin/benchmark --drivers [driver-path] [workload-path]
It starts the benchmark with a warm-up phase of 1 minute, and the starts the actual benchmark for 5 minutes:
INFO WorkloadGenerator - ----- Starting warm-up traffic (1m) ------
INFO WorkloadGenerator - Pub rate  1018.3 msg/s /  1.0 MB/s | Pub err     0.0 err/s | Cons rate  1018.3 msg/s /  1.0 MB/s | Backlog:  0.0 K | Pub Latency (ms) avg:  1.4 - 50%:  0.8 - 99%: 21.4 - 99.9%: 29.4 - Max: 30.9 | Pub Delay Latency (us) avg: 109.6 - 50%: 74.0 - 99%: 609.0 - 99.9%: 6171.0 - Max: 15553.0
INFO WorkloadGenerator - Pub rate  1018.8 msg/s /  1.0 MB/s | Pub err     0.0 err/s | Cons rate  1018.7 msg/s /  1.0 MB/s | Backlog:  0.0 K | Pub Latency (ms) avg:  1.2 - 50%:  1.2 - 99%:  1.8 - 99.9%:  3.4 - Max:  5.8 | Pub Delay Latency (us) avg: 99.3 - 50%: 95.0 - 99%: 194.0 - 99.9%: 671.0 - Max: 1864.0
Every 5 seconds reports windowed metrics:
INFO WorkloadGenerator - Pub rate  1023.8 msg/s /  1.0 MB/s | Pub err     0.0 err/s | Cons rate  1023.7 msg/s /  1.0 MB/s | Backlog:  0.0 K | Pub Latency (ms) avg:  1.2 - 50%:  1.2 - 99%:  2.2 - 99.9%: 26.1 - Max: 32.8 | Pub Delay Latency (us) avg: 99.5 - 50%: 94.0 - 99%: 248.0 - 99.9%: 780.0 - Max: 1963.0
INFO WorkloadGenerator - ----- Aggregated Pub Latency (ms) avg:  1.3 - 50%:  1.2 - 95%:  1.7 - 99%:  4.9 - 99.9%: 28.3 - 99.99%: 39.3 - Max: 40.3 | Pub Delay (us)  avg: 102.8 - 50%: 93.0 - 95%: 152.0 - 99%: 273.0 - 99.9%: 1574.0 - 99.99%: 9971.0 - Max: 15553.0
INFO WorkloadGenerator - ----- Starting benchmark traffic (5m)------
INFO WorkloadGenerator - Pub rate  1055.7 msg/s /  1.0 MB/s | Pub err     0.0 err/s | Cons rate  1055.7 msg/s /  1.0 MB/s | Backlog:  0.0 K | Pub Latency (ms) avg:  1.5 - 50%:  1.4 - 99%:  6.5 - 99.9%: 33.0 - Max: 37.1 | Pub Delay Latency (us) avg: 112.1 - 50%: 99.0 - 99%: 331.0 - 99.9%: 1908.0 - Max: 7472.0
INFO WorkloadGenerator - Pub rate  1027.5 msg/s /  1.0 MB/s | Pub err     0.0 err/s | Cons rate  1027.6 msg/s /  1.0 MB/s | Backlog:  0.0 K | Pub Latency (ms) avg:  1.3 - 50%:  1.3 - 99%:  1.9 - 99.9%: 27.3 - Max: 34.2 | Pub Delay Latency (us) avg: 102.0 - 50%: 96.0 - 99%: 209.0 - 99.9%: 700.0 - Max: 5550.0
and at the end it writes the worker metrics to a result JSON file
INFO Benchmark - Writing test result into simple-workload-kafka-local-2024-12-21-10-26-21.json
Reviewing results
Results are collected from workers (same process in this case) and written down to a JSON file. This JSON file contains all the samples took during the exection. To plot them, use the following command:
bin/create_charts.py [results-path]
This will take all the results and generate SVG graphs to analyze the results, including:
- Publish, Publish Delay, and End-to-End Latency
- Publish, Publish Error, and Consume Rate

These results, along with server-side metrics, should give a good idea on how the cluster performed during the benchmark execution.
Summary
If you’re looking to quickly reproduce a specific workload on a Kafka cluster, this guide offers a starting point without requiring custom producer/consumer development. While benchmarking tools are typically associated with large-scale production environments, they can be valuable for simple one-off tests and experimentation.
In upcoming posts, I’ll explore other aspects of my Kafka performance testing journey including deep dives into OMB execution modes, specific Kafka feature testing, and broker profiling techniques.
References
- OpenMessaging Benchmark: The documentation lacks some level of detail, and there are few details that require diving into the code to figure out.
- Documentation: https://openmessaging.cloud/docs/benchmarks/
- Repository: https://github.com/openmessaging/benchmark
- Vendors using the OMB framework:
- Confluent: https://www.confluent.io/blog/kafka-fastest-messaging-system/ comparing Kafka with other messaging systems, like RabbitMQ and Pulsar.
- Redpanda: https://www.redpanda.com/blog/redpanda-vs-kafka-performance-benchmark showing how RedPanda compares to Apache Kafka.
- Warpstream: https://www.warpstream.com/blog/warpstream-benchmarks-and-tco showing how their platform performs under certain workloads.